October 11, 2017
Among the "headline" inflation numbers, experienced observers look not at the overall monthly, seasonally-adjusted CPI but at the CPI less food and energy. You all know what's happened to energy, but you also know that it's temporary, until the effects of Harvey wear off. Food has such effects when a droughts or floods will hit a major crop area one year but not the next. So look at the graphs – not a formal statistical test, but a start! – and look for co-movements of these three indices. Don't see any? Maybe that's why the focus is on "core" inflation!
...inflation remains below 2%...
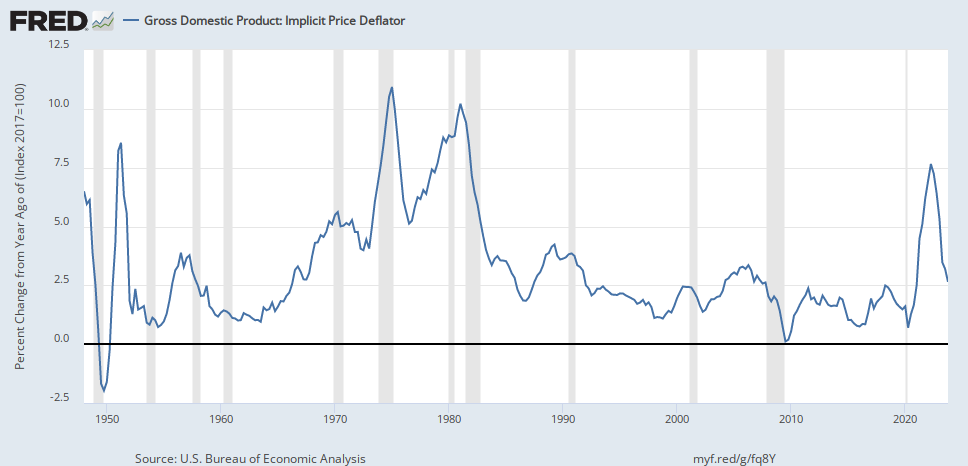
This is not the only way to try to get at "true" inflation. One is to trim extreme values, positive and negative, resulting in trimmed mean measures. Another is to divide the data into "flexible" and "sticky" prices. Then there are alternate series – the PCE (personal consumption expenditure) index, which uses the definition of consumption in GDP (for example different housing weights) or the broadest of all, the GDP deflator, which includes all goods and services included in GDP (investment, government, imports) and not just consumption. But you don't have to be picky: with thousands of prices reported each month, you can create your own, or you can turn to the Billion Prices Project web site, which uses online data to calculate inflation. (BTW, their data closely tracks the CPI – but they don't offer their latest data for free.)
| Headline | Core | Core Sticky | Core Flex | 16% Trimmed Mean | Median Price | Trimmed Mean PCE | GDP Deflator |
| - - - - - Sept 2017 - - - - - | 2017Q2 | ||||||
| 2.2% | 1.7% | 2.1% | -0.6% | 1.8% | 2.2% | 1.6% | 1.6% |
Note that I only report 2 significant digits. The computer automatically spits out more, but they're not meaningful.
Oh, the bottom line: inflation remains below 2.0% with no sign of an uptick. But because incremental changes to monetary policy take 9 months to have much effect, and 18 months for the full impact, the Fed has to think about what the economy will be like 4-6 quarters ahead. If we keep adding jobs faster than mandated by demographics, at some point labor markets will tighten and wages will rise ... I hope. Will that then lead to modest inflation and a "normalization" of interest rates? (All theory-laden terms, but not for this post!)
No comments:
Post a Comment